Please note that these are sample papers that we use to revise before getting into the D100 objective assessment. It is not a guarantee that after you review them you will pass, but there is a very high chance that you will do.
If you do not want to risk failing do not hesitate to reach us out, we can take the exam for you and you are assured of passing. We wish you all the best as you revise
Section 1: Spreadsheet Basics and Navigation (15 Questions)
- Question: What is the primary purpose of a spreadsheet program like Microsoft Excel or Google Sheets?
- Answer: To organize, analyze, and store data in a structured, tabular format.
- Question: What is the difference between a workbook and a worksheet?
- Answer: A workbook is a spreadsheet file, while a worksheet is a single page or tab within that file.
- Question: How is a specific cell identified in a spreadsheet?
- Answer: A cell is identified by its column letter followed by its row number (e.g., A1, B5).
- Question: What is a cell reference?
- Answer: A cell reference is a code that identifies a cell or a range of cells, allowing you to use the data in formulas.
- Question: What is a range?
- Answer: A range is a selection of two or more cells, identified by the top-left cell and the bottom-right cell separated by a colon (e.g., A1:B10).
- Question: What does a formula bar do?
- Answer: The formula bar displays the content of the active cell, whether it’s text, a number, or a formula.
- Question: How can you quickly select an entire column?
- Answer: By clicking on the column header (the letter at the top of the column).
- Question: What is the active cell?
- Answer: The active cell is the currently selected cell, indicated by a bold border.
- Question: What is a label in a spreadsheet?
- Answer: A label is a text entry in a cell, such as a title or a column heading.
- Question: What does a fill handle do?
- Answer: The fill handle is a small black square at the bottom-right corner of the active cell, used to copy data or formulas to adjacent cells.
- Question: What is the shortcut to enter the current date into a cell?
- Answer:
Ctrl + ;(semicolon).
- Answer:
- Question: How do you rename a worksheet?
- Answer: Double-click on the worksheet tab at the bottom of the screen.
- Question: What is the purpose of freezing panes?
- Answer: Freezing panes locks specific rows or columns in place so they remain visible when you scroll through a large spreadsheet.
- Question: How do you insert a new row into a spreadsheet?
- Answer: Right-click on a row number and select “Insert.”
- Question: What is the function of the Name Box?
- Answer: The Name Box displays the address of the active cell or the name of a selected range.
Section 2: Formulas and Functions (15 Questions)
- Question: What character must every formula begin with in a spreadsheet?
- Answer: The equals sign (
=).
- Answer: The equals sign (
- Question: What is the purpose of the
SUMfunction?- Answer: To add a range of numbers. For example,
=SUM(A1:A10).
- Answer: To add a range of numbers. For example,
- Question: What does the
AVERAGEfunction do?- Answer: It calculates the arithmetic mean of a range of numbers.
- Question: What is the difference between a relative cell reference and an absolute cell reference?
- Answer: A relative reference (e.g.,
A1) changes when a formula is copied to another cell. An absolute reference (e.g.,$A$1) remains fixed, indicated by a dollar sign.
- Answer: A relative reference (e.g.,
- Question: What is a mixed reference?
- Answer: A mixed reference has either a fixed column or a fixed row, but not both (e.g.,
A$1or$A1).
- Answer: A mixed reference has either a fixed column or a fixed row, but not both (e.g.,
- Question: What is the purpose of the
COUNTfunction?- Answer: It counts the number of cells in a range that contain numerical data.
- Question: What is the purpose of the
IFfunction?- Answer: It allows you to perform a logical test and return one value if the condition is true and another if it’s false.
- Question: What does the
MAXfunction do?- Answer: It finds the largest value in a range of numbers.
- Question: What does the
MINfunction do?- Answer: It finds the smallest value in a range of numbers.
- Question: What is a nested function?
- Answer: A nested function is a function that is placed inside another function.
- Question: What does the
TODAY()function do?- Answer: It returns the current date and automatically updates each time the worksheet is opened.
- Question: How do you calculate a percentage in a spreadsheet?
- Answer: Divide the part by the whole (e.g.,
=A2/B2).
- Answer: Divide the part by the whole (e.g.,
- Question: What is a conditional format?
- Answer: A feature that allows you to change the format of a cell based on a specific condition or rule.
- Question: What is the purpose of the
VLOOKUPfunction?- Answer: It looks for a value in the first column of a table and returns a corresponding value from a specified column in the same row.
- Question: What does the
#DIV/0!error indicate?- Answer: It indicates that a formula is trying to divide a number by zero.
Section 3: Data Analysis and Visualization (15 Questions)
- Question: What is the purpose of sorting data in a spreadsheet?
- Answer: To arrange data in a specific order, such as alphabetical or numerical.
- Question: What is the purpose of filtering data in a spreadsheet?
- Answer: To display only the data that meets specific criteria, hiding the rest.
- Question: What is a bar chart primarily used for?
- Answer: To compare different data categories using rectangular bars.
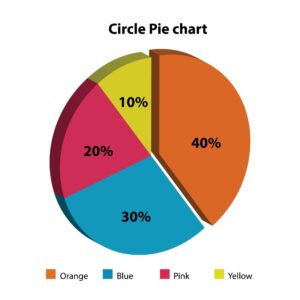
- Question: When would you use a pie chart?
- Answer: To show the proportion or percentage of each category relative to a whole.
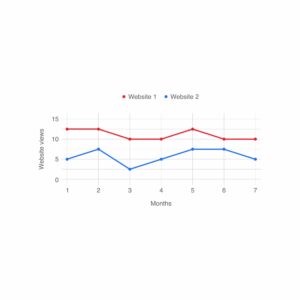
- Question: When is a line chart most appropriate?
- Answer: A line chart is best used to show trends or changes in data over a period of time.
- Question: What is a pivot table?
- Answer: A tool used to summarize, analyze, and present large amounts of data by rearranging and aggregating it.
- Question: What is the purpose of a scatter plot?
- Answer: To show the relationship or correlation between two sets of numerical data.
- Question: What are sparklines?
- Answer: Tiny charts placed within a single cell, used to show a quick visual trend for a specific row of data.
- Question: What is the purpose of a data validation rule?
- Answer: To restrict the type of data or the values that users can enter into a cell.
- Question: What does a bubble chart show?
- Answer: A bubble chart shows three dimensions of data, with the size of the bubble representing the third variable.
- Question: What does a histogram show?
- Answer: A histogram shows the frequency distribution of a dataset.
- Question: What is the primary benefit of using a template in a spreadsheet program?
- Answer: A template provides a pre-formatted structure, saving time and ensuring consistency.
- Question: What is the purpose of the “What-If Analysis” tool?
- Answer: To test various scenarios to see how a change in one or more variables affects an outcome.
- Question: What does a column chart show?
- Answer: It is a vertical bar chart used to compare data across categories.
- Question: What is the primary purpose of adding titles and labels to a chart?
- Answer: To make the chart easy to understand by clearly identifying what the data represents.